Appearance
Cisco CUBE Call Analytics & Reporting (XCC)
Call Telemetry provides comprehensive Cisco CUBE call analytics and reporting through real-time dashboards and historical analysis. Monitor voice quality, call patterns, and network performance with advanced analytics specifically designed for Cisco CUBE environments.
What are Cisco CUBE Call Analytics?
Cisco CUBE (Collaboration Universal Border Element) call analytics provides real-time and historical visibility into your voice communications at the network edge. Unlike basic CDR reporting, CUBE analytics offers:
- Real-time Quality Monitoring: Live MOS scores, jitter, packet loss, and RTT metrics
- Call Volume Analytics: Peak usage patterns, busy hour analysis, and capacity planning
- SIP Peer Performance: Individual peer health monitoring and usage statistics
- Network Edge Visibility: See calls before they reach your internal infrastructure
- Quality Trend Analysis: Historical performance patterns and baseline monitoring
- Detailed Call Records: Comprehensive call details including quality metrics and disconnect reasons
Policy and Performance in Realtime
CUBE XCC enables real-time monitoring and enforcement of call policies, ensuring optimal performance and compliance at the network edge. By integrating with Cisco CUBE, it provides immediate insights into call quality and peer health, allowing for proactive management and rapid response to issues.
You do not have to block calls, but you must have at least one policy active with a default permit rule to trigger call metric processing.
With Call Telemetry's CUBE integration, you get real-time call analytics, policy enforcement, and a comprehensive view of your network edge voice performance and health. Call Telemetry uses XCC API's and the SIP native P-RTP-Stat headers to collect and analyze call quality metrics in real-time, providing immediate insights.
Monitor calls that terminate at the CUBE edge before reaching your Cisco CallManager, providing critical visibility into blocked or rejected calls that never appear in CUCM CDR reports. This edge-level monitoring identifies routing issues and carrier problems that would otherwise be invisible.
Complete Analytics Ecosystem
For comprehensive call analytics and reporting, CUBE XCC works alongside other Call Telemetry components:
- Cisco CUBE XCC Integration - Configure real-time call monitoring and quality metrics collection from your CUBE gateway
- Cisco CDR Reporting - Historical call accounting and detailed call records for compliance and billing analysis
- Cisco CMR Quality Reports - Endpoint-specific quality metrics and phone diagnostics for troubleshooting user experience issues
- Architecture Overview - Understanding how XCC fits with CUCM and CUBE in your voice infrastructure
Feature Overview
The CUBE Analytics is now a real-time dashboard providing drilldown of metrics and call details per Cube, and per Peer health. Health is monitored through KPIs like MOS Score, Jitter, and Packet loss, measured over time with accurate and relevant insights. Instead of hard fixed thresholds, the system adapts in realtime to changing network conditions, raising alarms over significant deviations from normal baseline.
The CUBE Analytics Dashboard offers:
- Real-time Dashboard: Live updating interface with configurable refresh intervals (1, 5, 10, 15, 30, 60 minutes)
- Peer Health Dashboard: New KPI dashboard providing real-time visibility into voice gateway health with peer status, key metrics, and recent activity
- Voice Quality Analytics: Real-time MOS scoring, jitter analysis, and packet loss monitoring - per Cube, and per Dial Peer
- Adaptive Health Monitoring: Intelligent health assessment using weighted decays and baseline deviation detection instead of fixed thresholds
- Disconnect Code Analysis: Enhanced call failure categorization and abnormal call filtering
- Historical Analysis: Analyze trends over time with customizable date ranges
- Call Quality Metrics: Report on Call MOS scores, packet loss, and round-trip time
- Call Volume Tracking: Monitor concurrent call volumes for capacity planning
- Hourly Distribution: View call volume patterns by hour of day for resource planning
- Inbound/Outbound Analysis: Compare incoming and outgoing call traffic patterns
- Detailed Call Records: Access comprehensive information about individual calls
Feature Requirements
- Call Telemetry Server Appliance 0.8.4 or later
- Call Telemetry Advanced License
- Configured CUBE XCC Integration
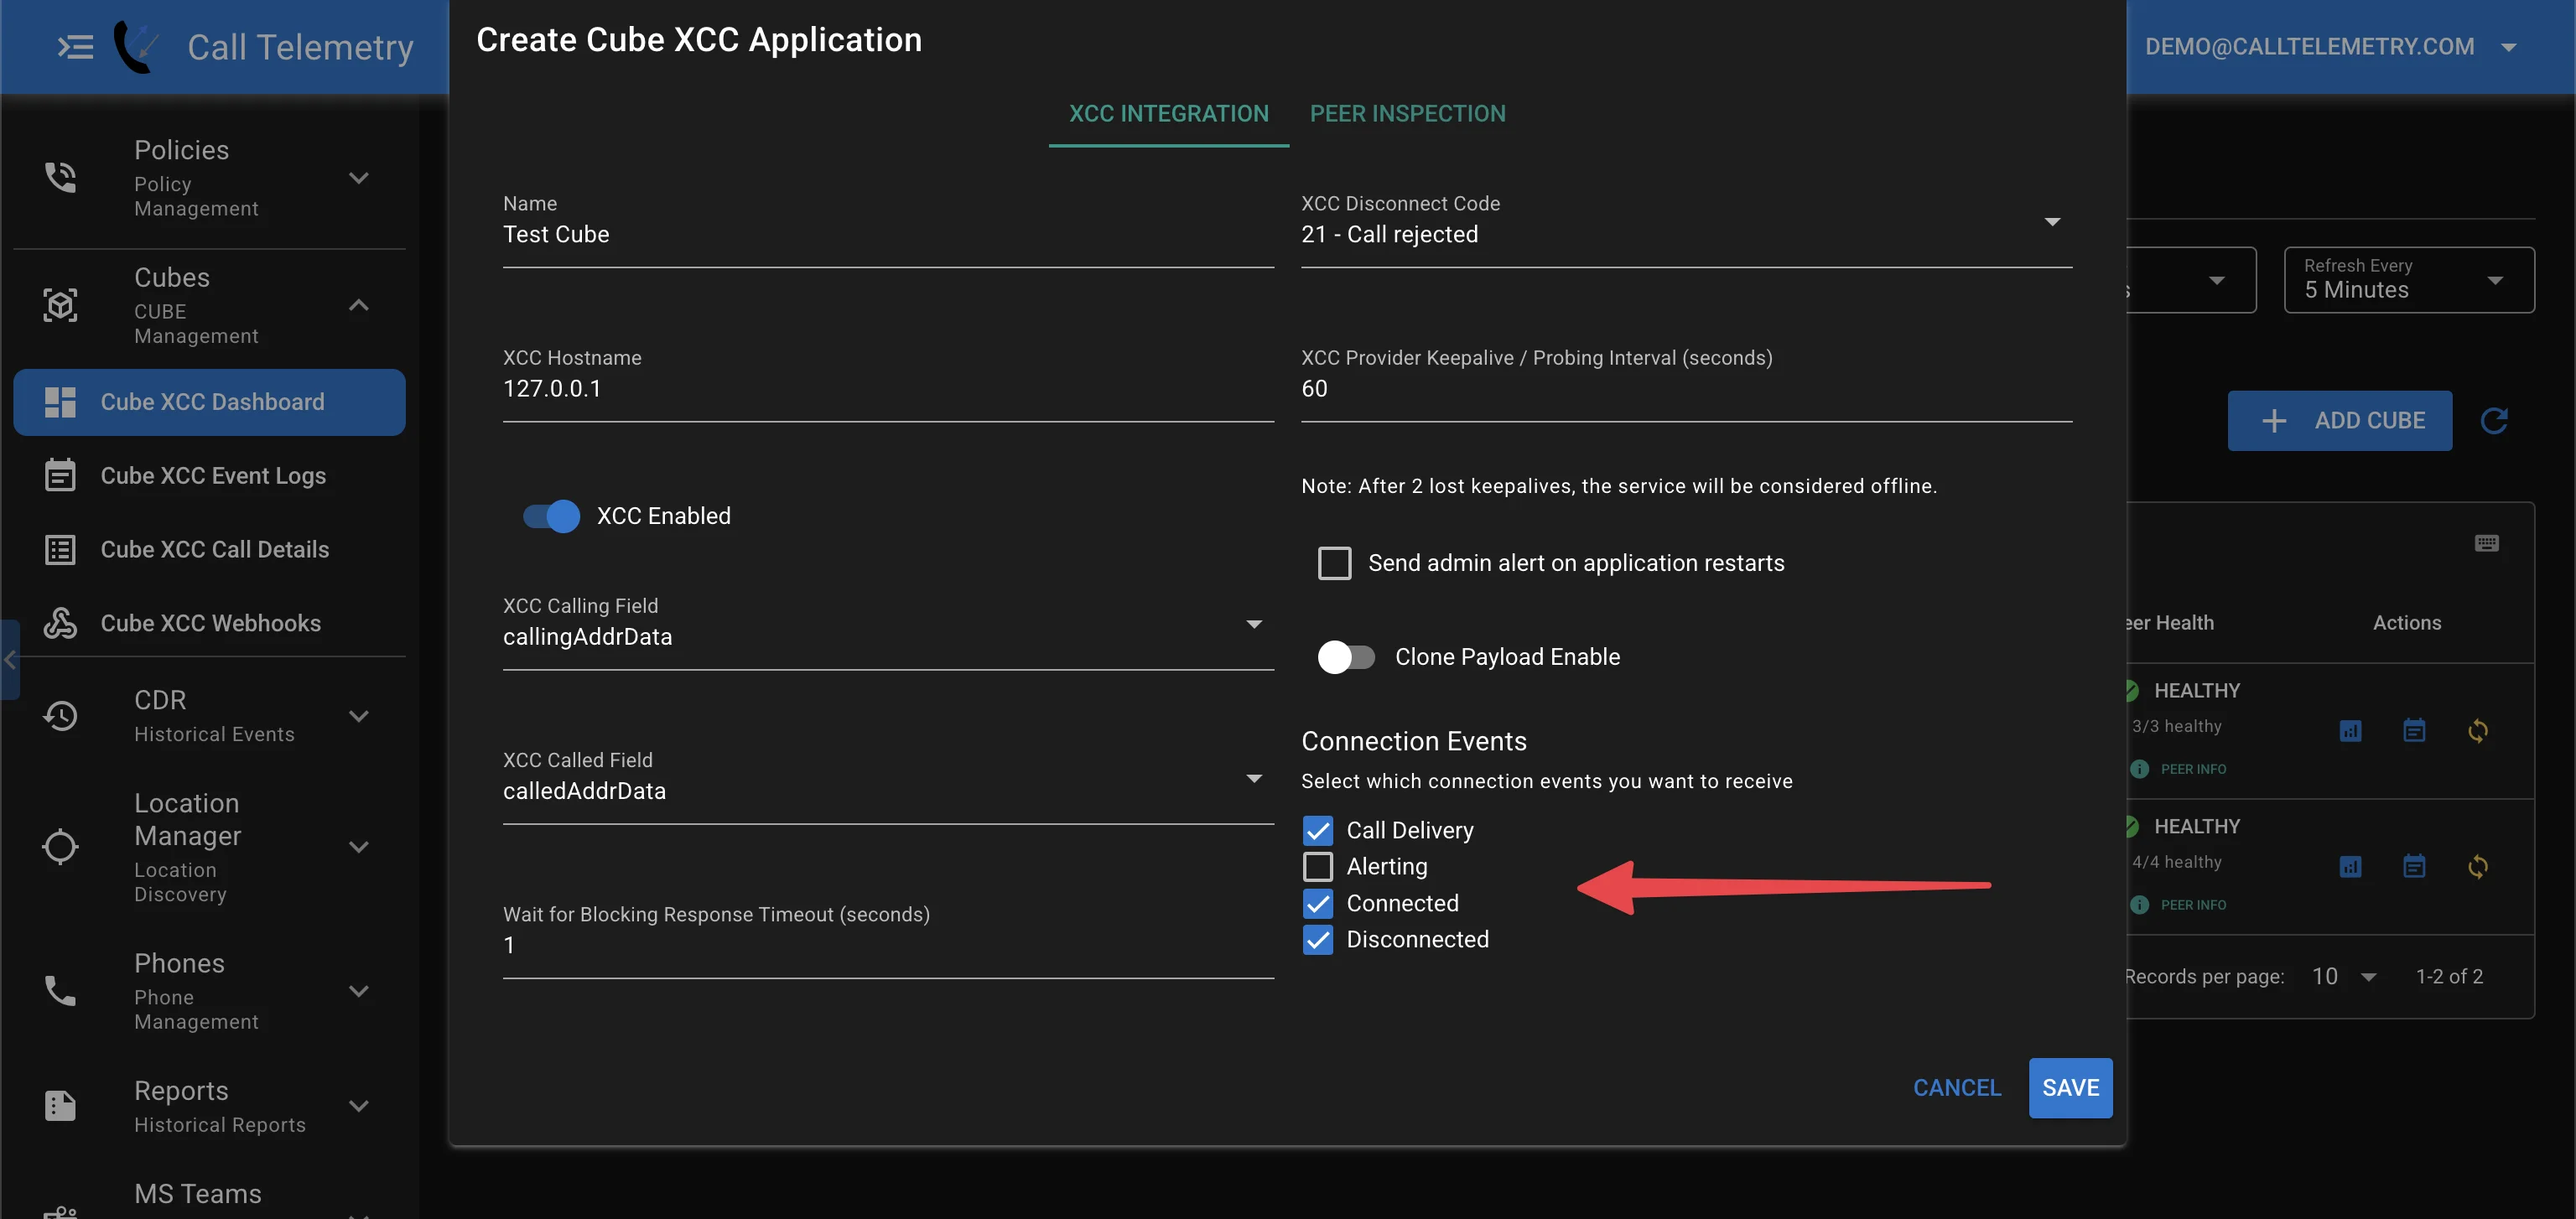
- Enabled Connected and Disconnect Events to your CUBE XCC integration to enable quality reporting (bottom right corner of the integration page). Go to Sidebar -> Cubes -> Cube Overview
IOS Router Call Quality Configuration
On the CUBEs to monitor, add the following callmonitor configuration as per Cisco IOS Call Quality Monitoring Docs to enable quality metrics with disconnect events and call quality statistics:
bash
callmonitor
  rtcpall-pass-through    # Passes through all RTCP packets in data path for end-to-end statistics
  media statistics        # Enables collection of media-related statistical information (MOS, jitter, packet loss)
  media bulk-stats        # Enables bulk statistical collection for media sessions across multiple calls
  call-quality            # Enters call quality configuration mode for global QoS setup
    max-dropout 100         # Configures acceptable out-of-sequence future packets to drop (default: 100)
    max-reorder 100         # Configures acceptable out-of-sequence late packets for reordering (default: 100)
That's it! Now your CUBEs are streaming send detailed call quality metrics to the Call Telemetry server, enabling real-time call analytics and call quality reporting.
Configuration Notes:
- SIP-to-SIP calls only: Call quality statistics are only supported for SIP-to-SIP call legs
- RTCP dependency: Round-trip delay metrics require RTCP packets from remote endpoints
- P-RTP-Stat generation: These settings enable the P-RTP-Stat headers in BYE/200 OK messages that feed our real-time analytics
Accessing the Dashboard
To access the Cube XCC Analytics Dashboard:
- Log in to your Call Telemetry dashboard
- Navigate to Cubes -> Cube XCC Dashboard
- Select a specific Cube from the overview page to view its metrics (click the metrics icon)
Cube Call Health Reports
Cube XCC Analytics Dashboard provides the single pane of glass across all your configured Cubes, displaying health metrics for each Cube - such as total calls, average MOS score, packet loss, and jitter. You can also view Peer Health based on call quality for each of your Cube's upstream and downstream peers.

Customizing the Dashboard Time and Refresh Rate
The Cube Overview Dashboard offers several customization options for time, interval, and refresh rate. You can adjust the time period with several preset choices or custom windows, window interval size, and timezone to better analyze call data and identify trends.
Timezone Selection
The dashboard displays all times in your local timezone. You can change the timezone by clicking on the timezone dropdown in the top-right corner of the page. This allows you to view data in other timezones.
Window Interval Size
Control data aggregation with the Window Size dropdown. For example, if you select a 1-hour time period with a 5-minute window size, the data will be aggregated into 5-minute intervals. This allows you to view trends and patterns over different time frames.
- Smaller window sizes (1 minute, 5 minutes): Provide more granular data, may impact query time and rendering of graphs
- Larger window sizes (1 hour, 4 hours): Better for viewing long-term trends
Real-time Health - Automatic Refresh
The CUBE Dashboard refreshes automatically based on the selected refresh interval (default 5 minutes), ensuring you always see the most up-to-date information and health KPIs and trend data. Clients use this as a real-time monitoring tool to quickly identify and address potential issues.
You can drill down all call quality and metric reports by Time and specific Peer IP Addresses, even pulling the call ID to get SIP traces per call.
TIP
Think of the CUBE Dashboard as your overall CUBE's health, with blended metrics from all calls and peers. Whenever you notice anomalies or new trends, you can drill down into specific metrics or time periods to identify root causes.
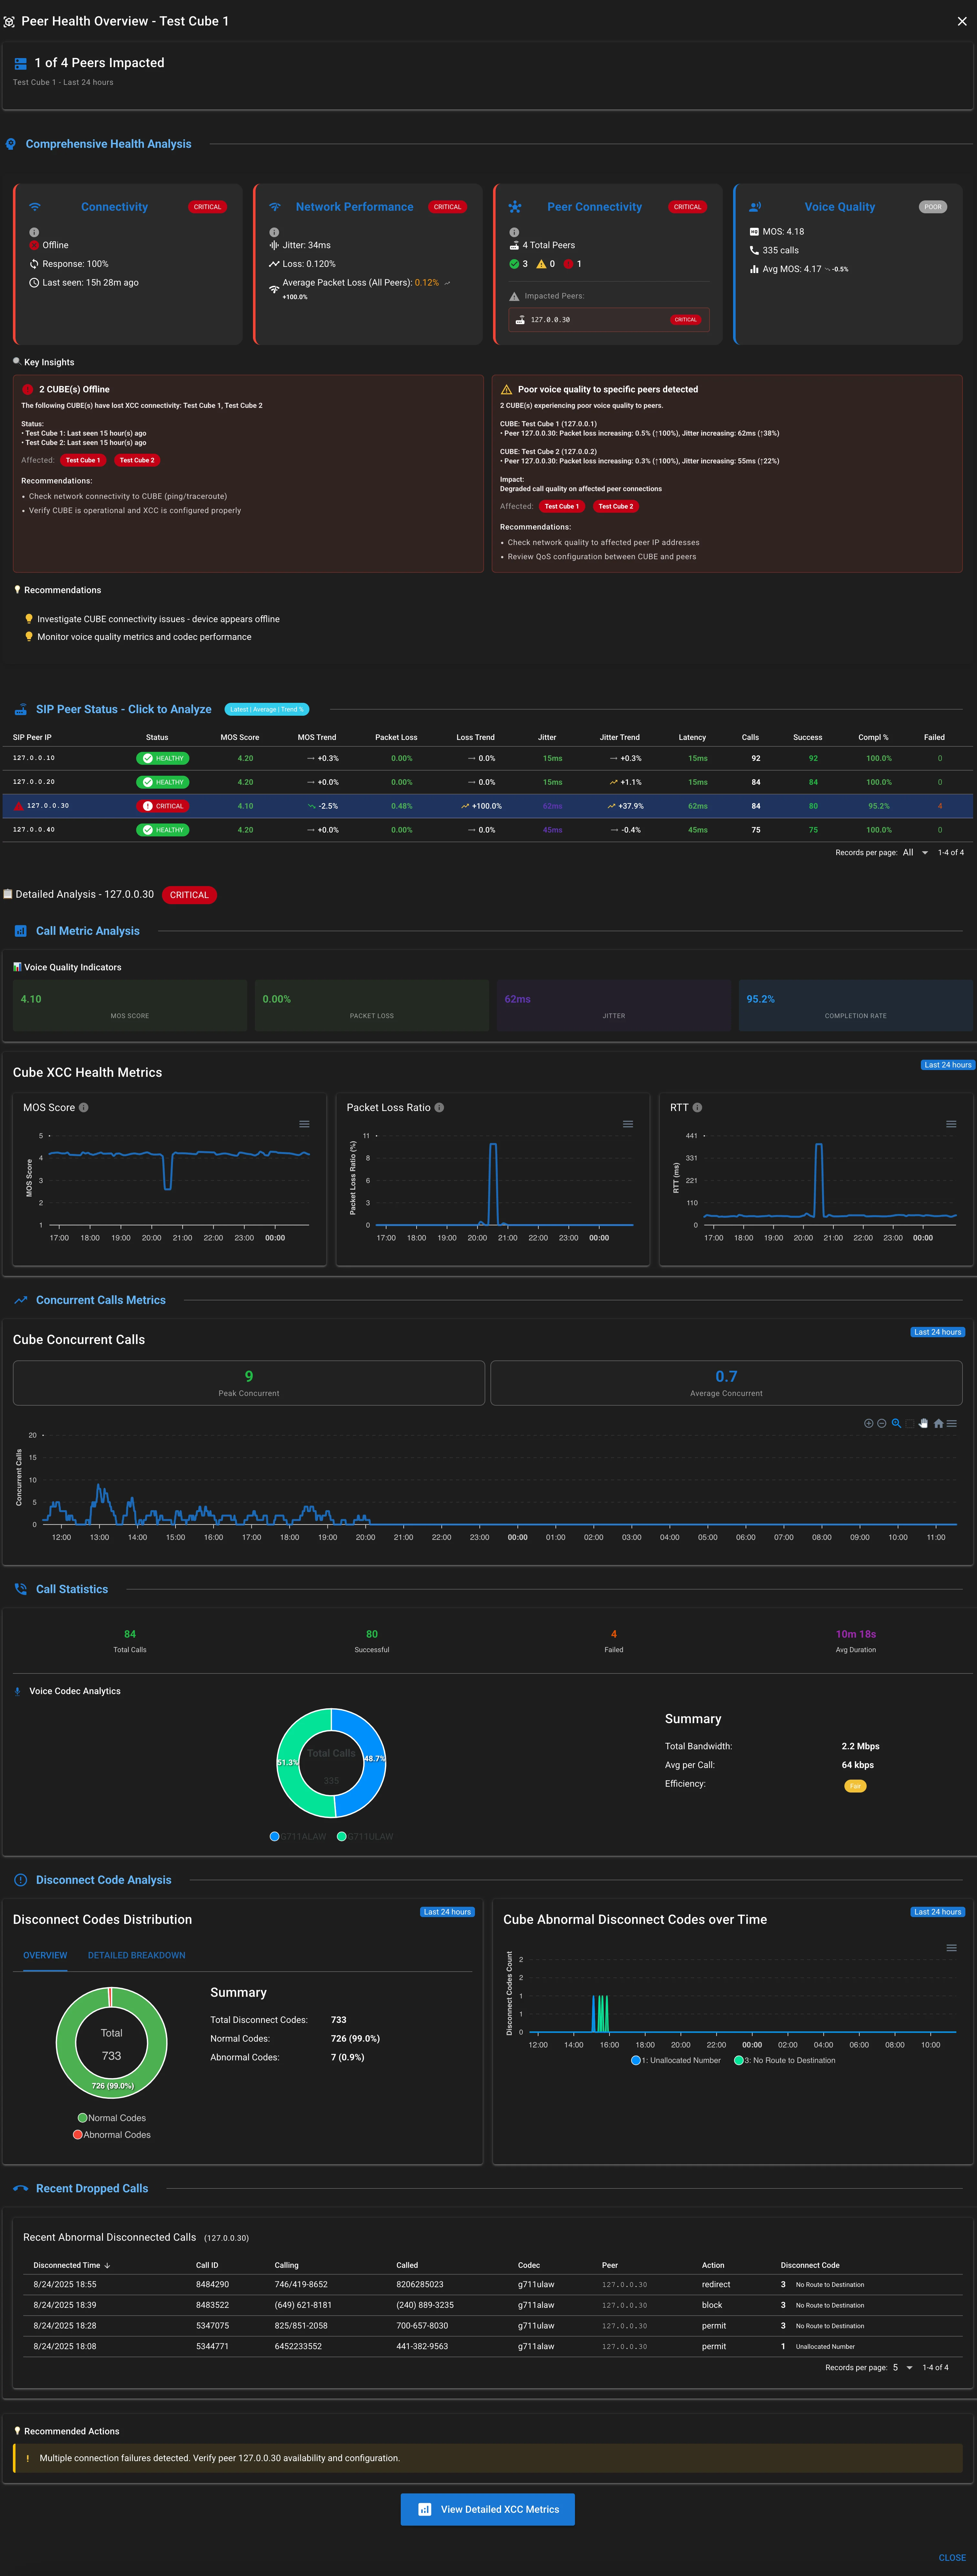
CUBE Peer Info Health Analytics
The CUBE Peer Health Analytics shows you detailed insights into the health and performance of each peer connection managed by your Cisco CUBE devices. This includes real-time metrics on call quality, connection stability, and traffic patterns, enabling you to quickly identify and address issues at the Cube, and inidividual upstream Peer level.

Cube Peer Analysis
From the CUBE Overview page, you get immediate feedback on the health and performance of each peer connection, and the overall CUBE's health. Click Peer Info and you can quickly drill down into detailed metrics for individual peers, helping you identify and resolve issues more efficiently.
Peer Health includes several components:
Comprehensive Health Analysis
- Identifies issues with Connection, Network, Peer Connecticity, and Voice Qualtiy at glance.
- Lists out Alarms and specific key insights with action steps to investigate.
SIP Peer Status
Shows a full table of all Peers detected, and their current and trending MOS, Jitter, and Packet Loss, and call volume. Click on any Peer to load drill down quality metrics below.
Peer Drill Down Metrics
Once a peer is selected, the page refreshes with specific data for the peer:
- Call Metrics - MOS, Jitter, Packet Loss
- Call Volume and Average Duration
- Codec and Bandwidth Usage
- Disconnect Causes Analysis
- Recent dropped calls during the time period
CUBE XCC Call Analytics (Metrics & Health)
The CUBE XCC Metrics Page displays key metrics that indicate the overall health of your voice communications using adaptive monitoring. Instead of relying on fixed thresholds, the system monitors health through KPIs measured over time with weighted decays, providing more accurate and relevant insights by adapting to changing network conditions and raising alarms based on significant deviations from established baselines.
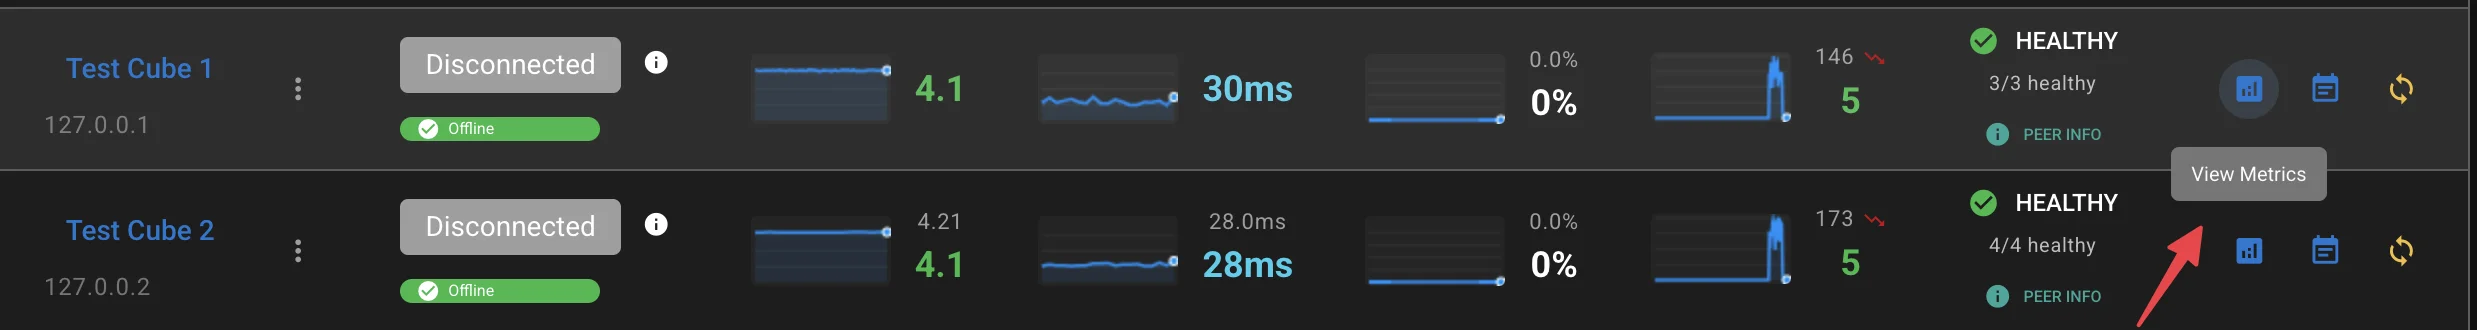
Click the View Metrics button to open the Call Analytics dashboard for a detailed view of call quality and performance metrics.
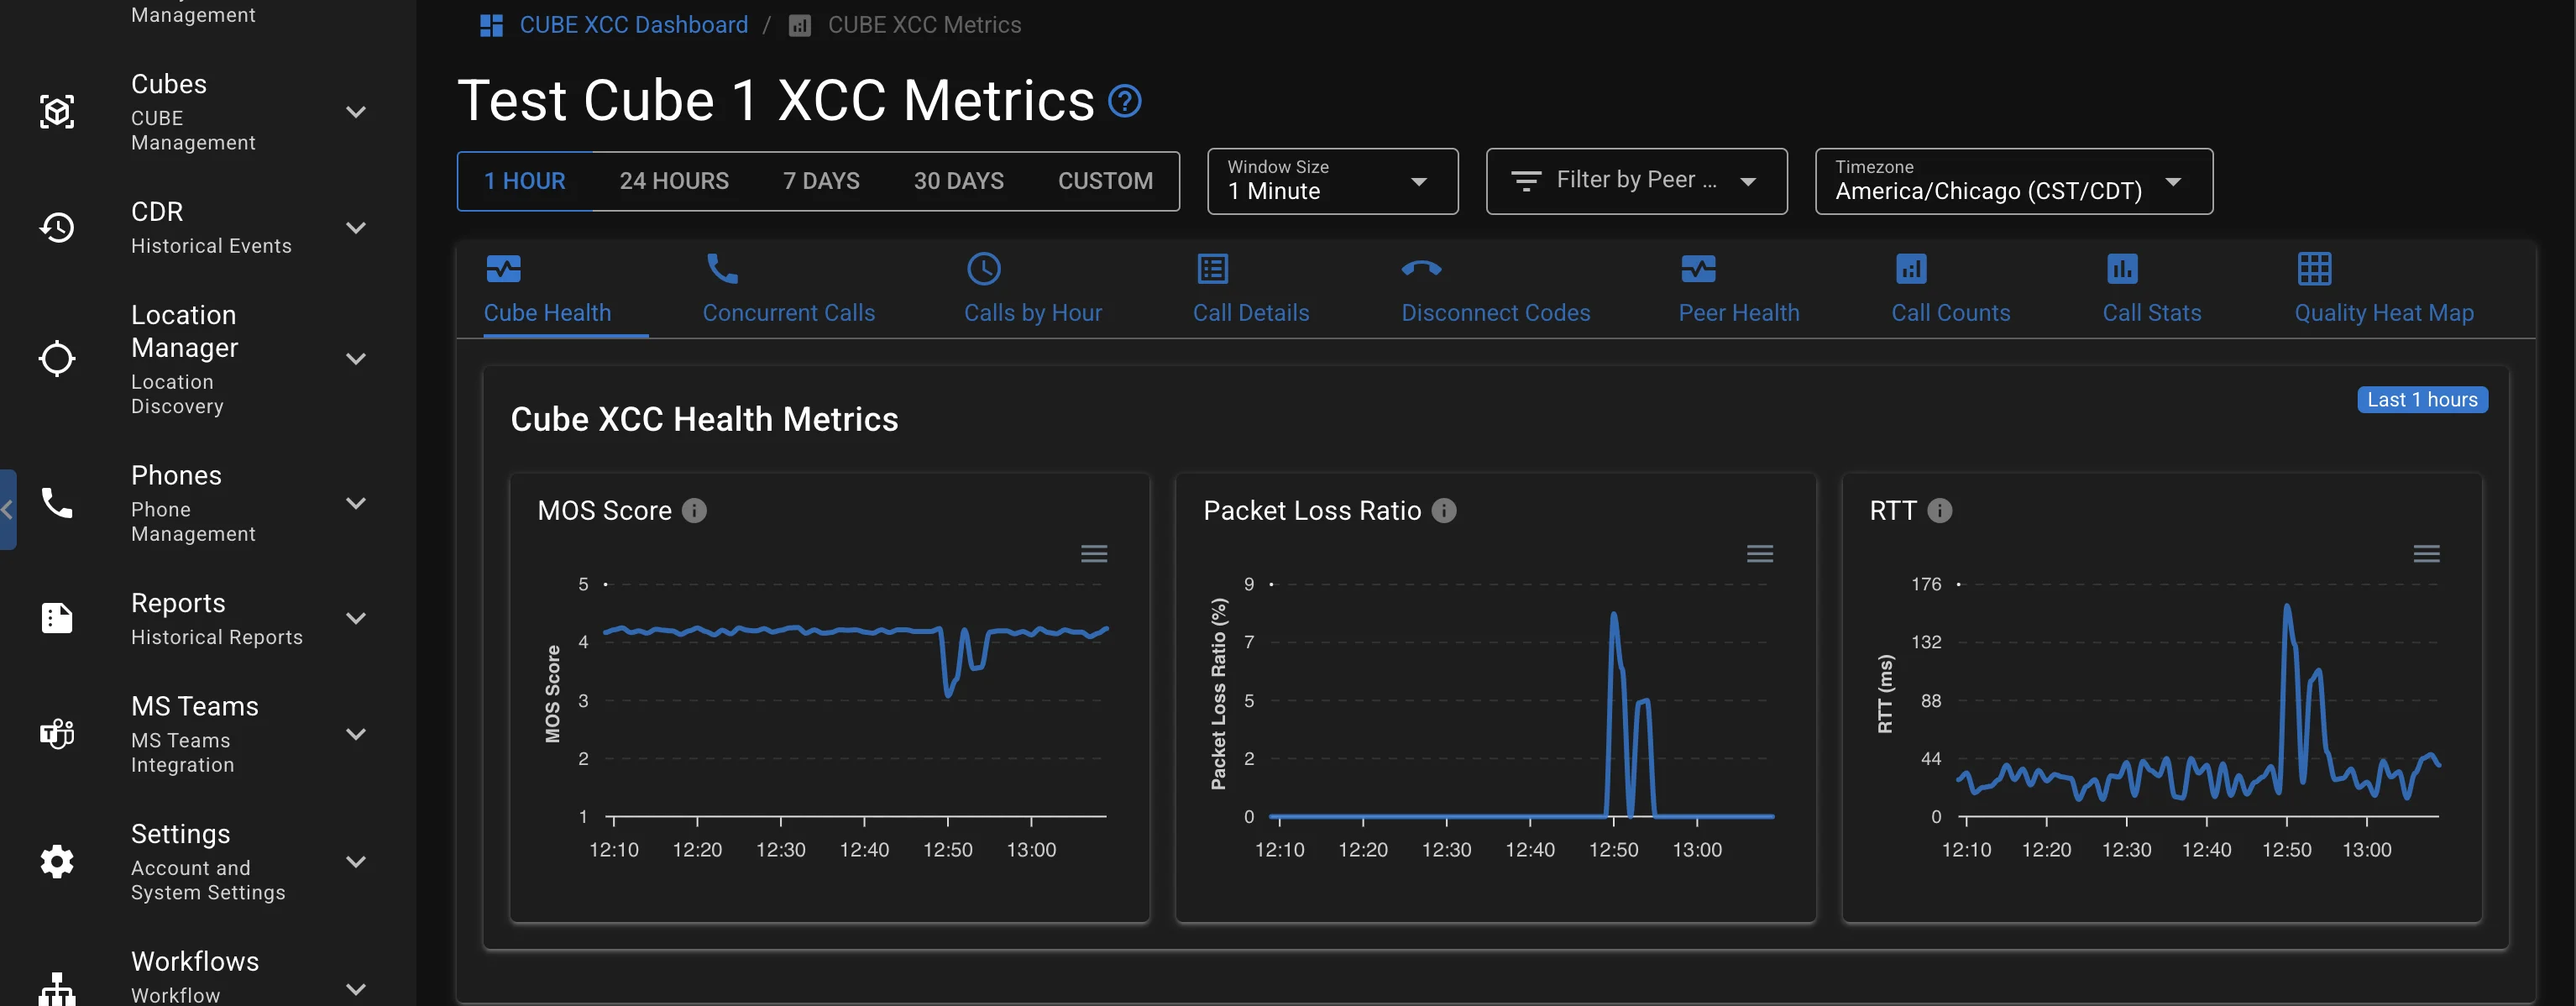
INFO
Notice the trend above? It's classic congestion. Packet loss and Jitter raise, causing the MOS Call Quality Score to drop.
CUBE Health and Quality Reports
Get real-time visibility into your voice gateway health with detailed metrics for each peer connection. The dashboard shows call quality, recent activity, and performance trends to help you quickly spot issues.
Understanding the Quality Metrics
MOS Score - Think of this like a 5-star rating for call quality. Higher is better:
- 4.0+: Excellent - crystal clear audio
- 3.0-4.0: Good - minor issues but still clear
- Below 3.0: Poor - users will complain about quality
Packet Loss - When voice data gets lost in transit:
- Under 1%: Great - no noticeable issues
- 1-5%: Acceptable - might hear occasional dropouts
- Over 5%: Problem - choppy audio, missing words
RTT (Delay) - How long it takes voice packets to travel back and forth:
- Under 150ms: Great - natural conversation flow
- 150-300ms: Noticeable - slight delay, people might talk over each other
- Over 300ms: Annoying - satellite phone-like delays
Concurrent Calls & Busy Hour Call Completions (BHCC)
The Concurrent Calls analytics provide comprehensive visibility into simultaneous active calls over time, combining general usage patterns with busy hour analysis for complete capacity planning insights.
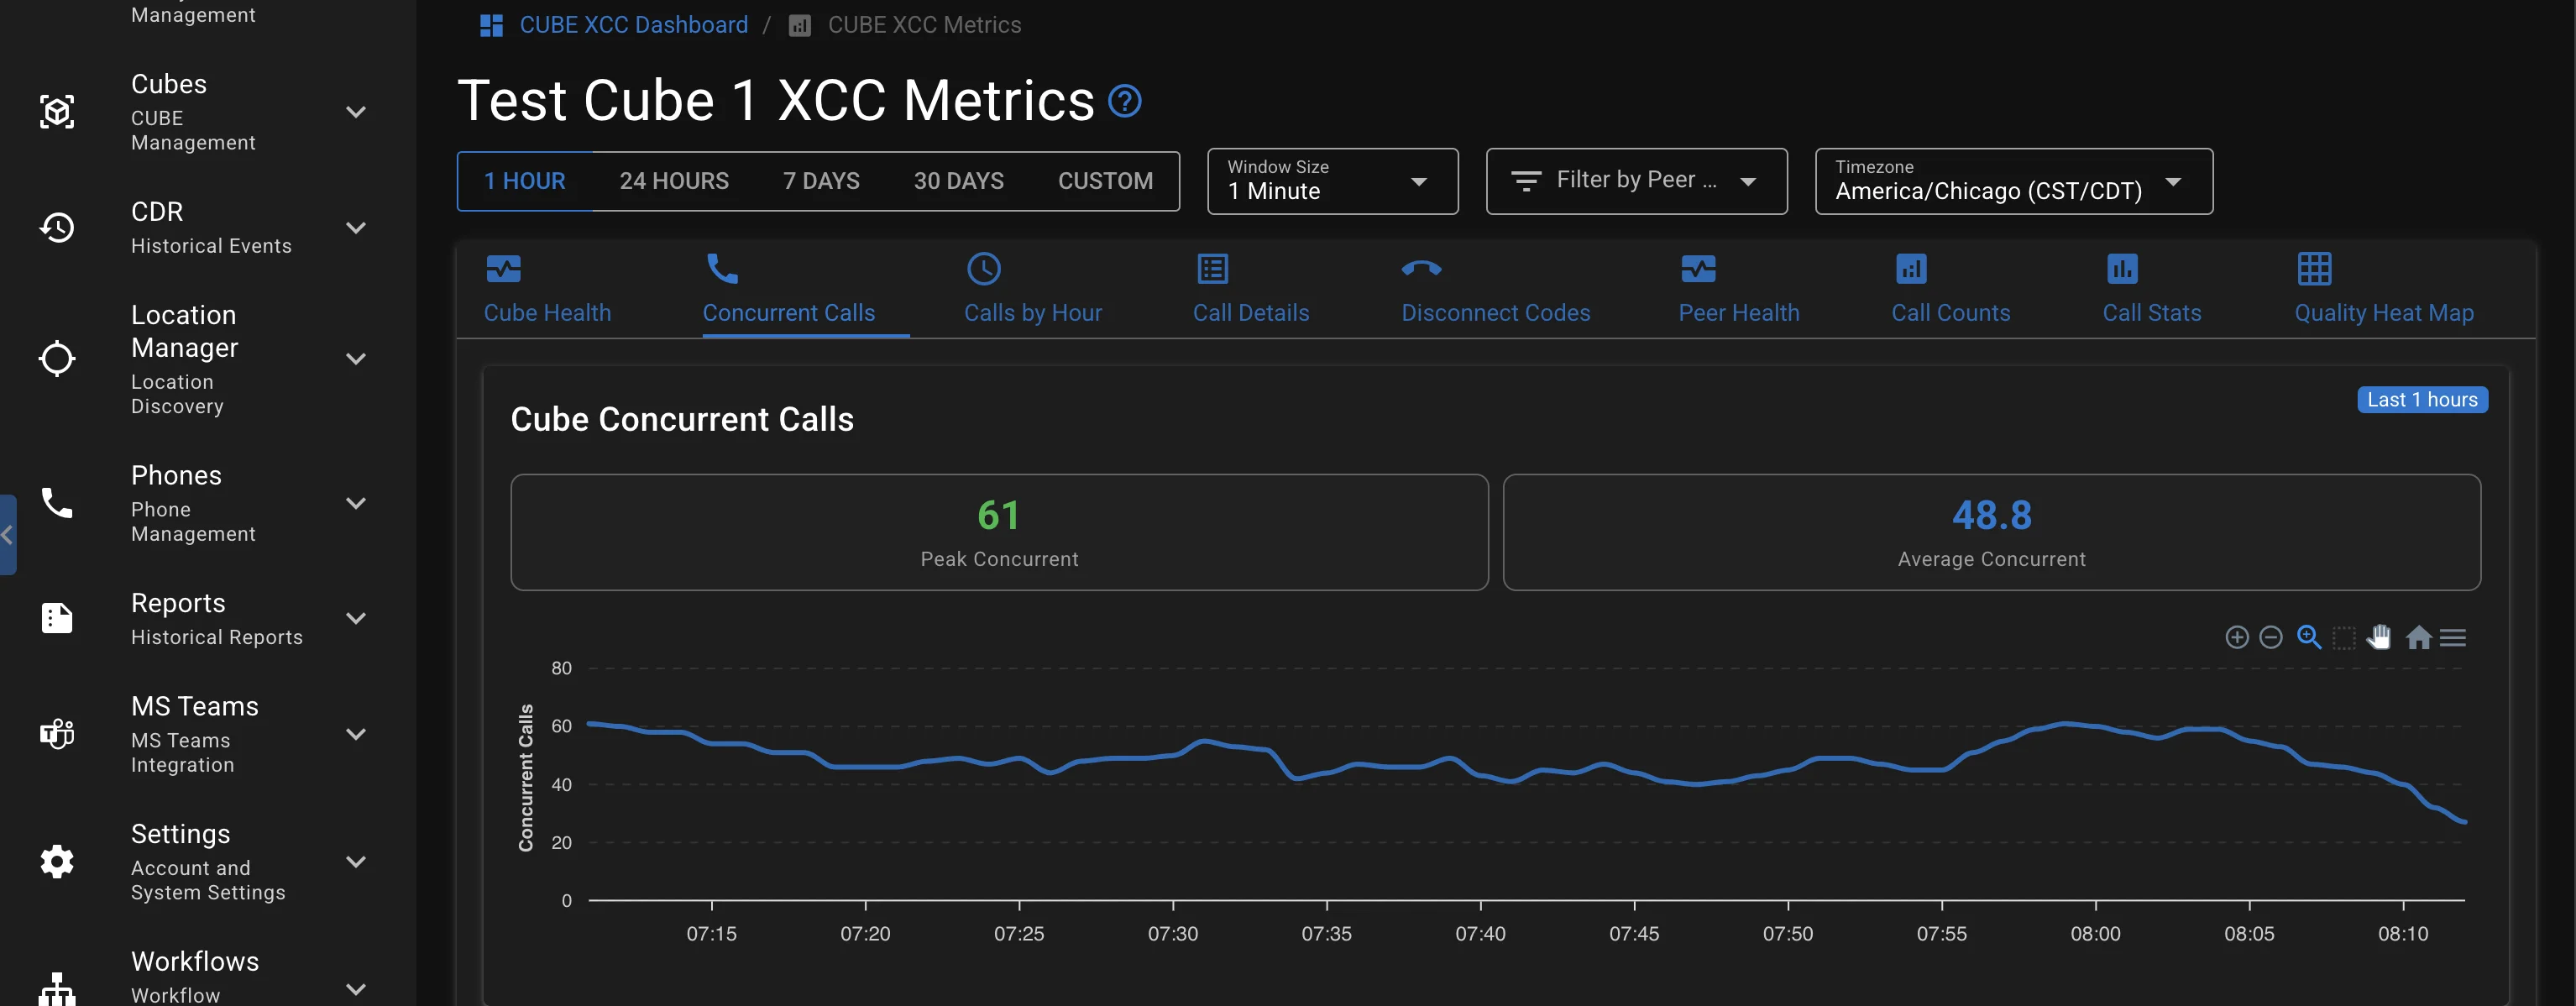
Real-Time Concurrent Call Monitoring:
- Monitor simultaneous active calls in real-time
- Track peak usage periods and system load patterns
- Correlate call volume with quality issues during high-traffic periods
- View concurrent call trends across customizable time windows
Busy Hour Call Completions (BHCC) Analysis: BHCC identifies the hour with the most completed calls; combine with concurrent call data for accurate capacity planning.
- Peak Hour Identification: Automatically identifies the busiest hour across your selected time period
- Concurrent Call Peaks: Shows maximum simultaneous active calls during busy periods
- Capacity Planning Metrics: Historical peak data for infrastructure sizing decisions
- Resource Optimization: Identifies when additional capacity or load balancing is needed
This unified view enables both immediate load monitoring and strategic capacity planning by combining real-time concurrent call tracking with focused analysis of peak utilization periods that drive infrastructure requirements.
Call Details
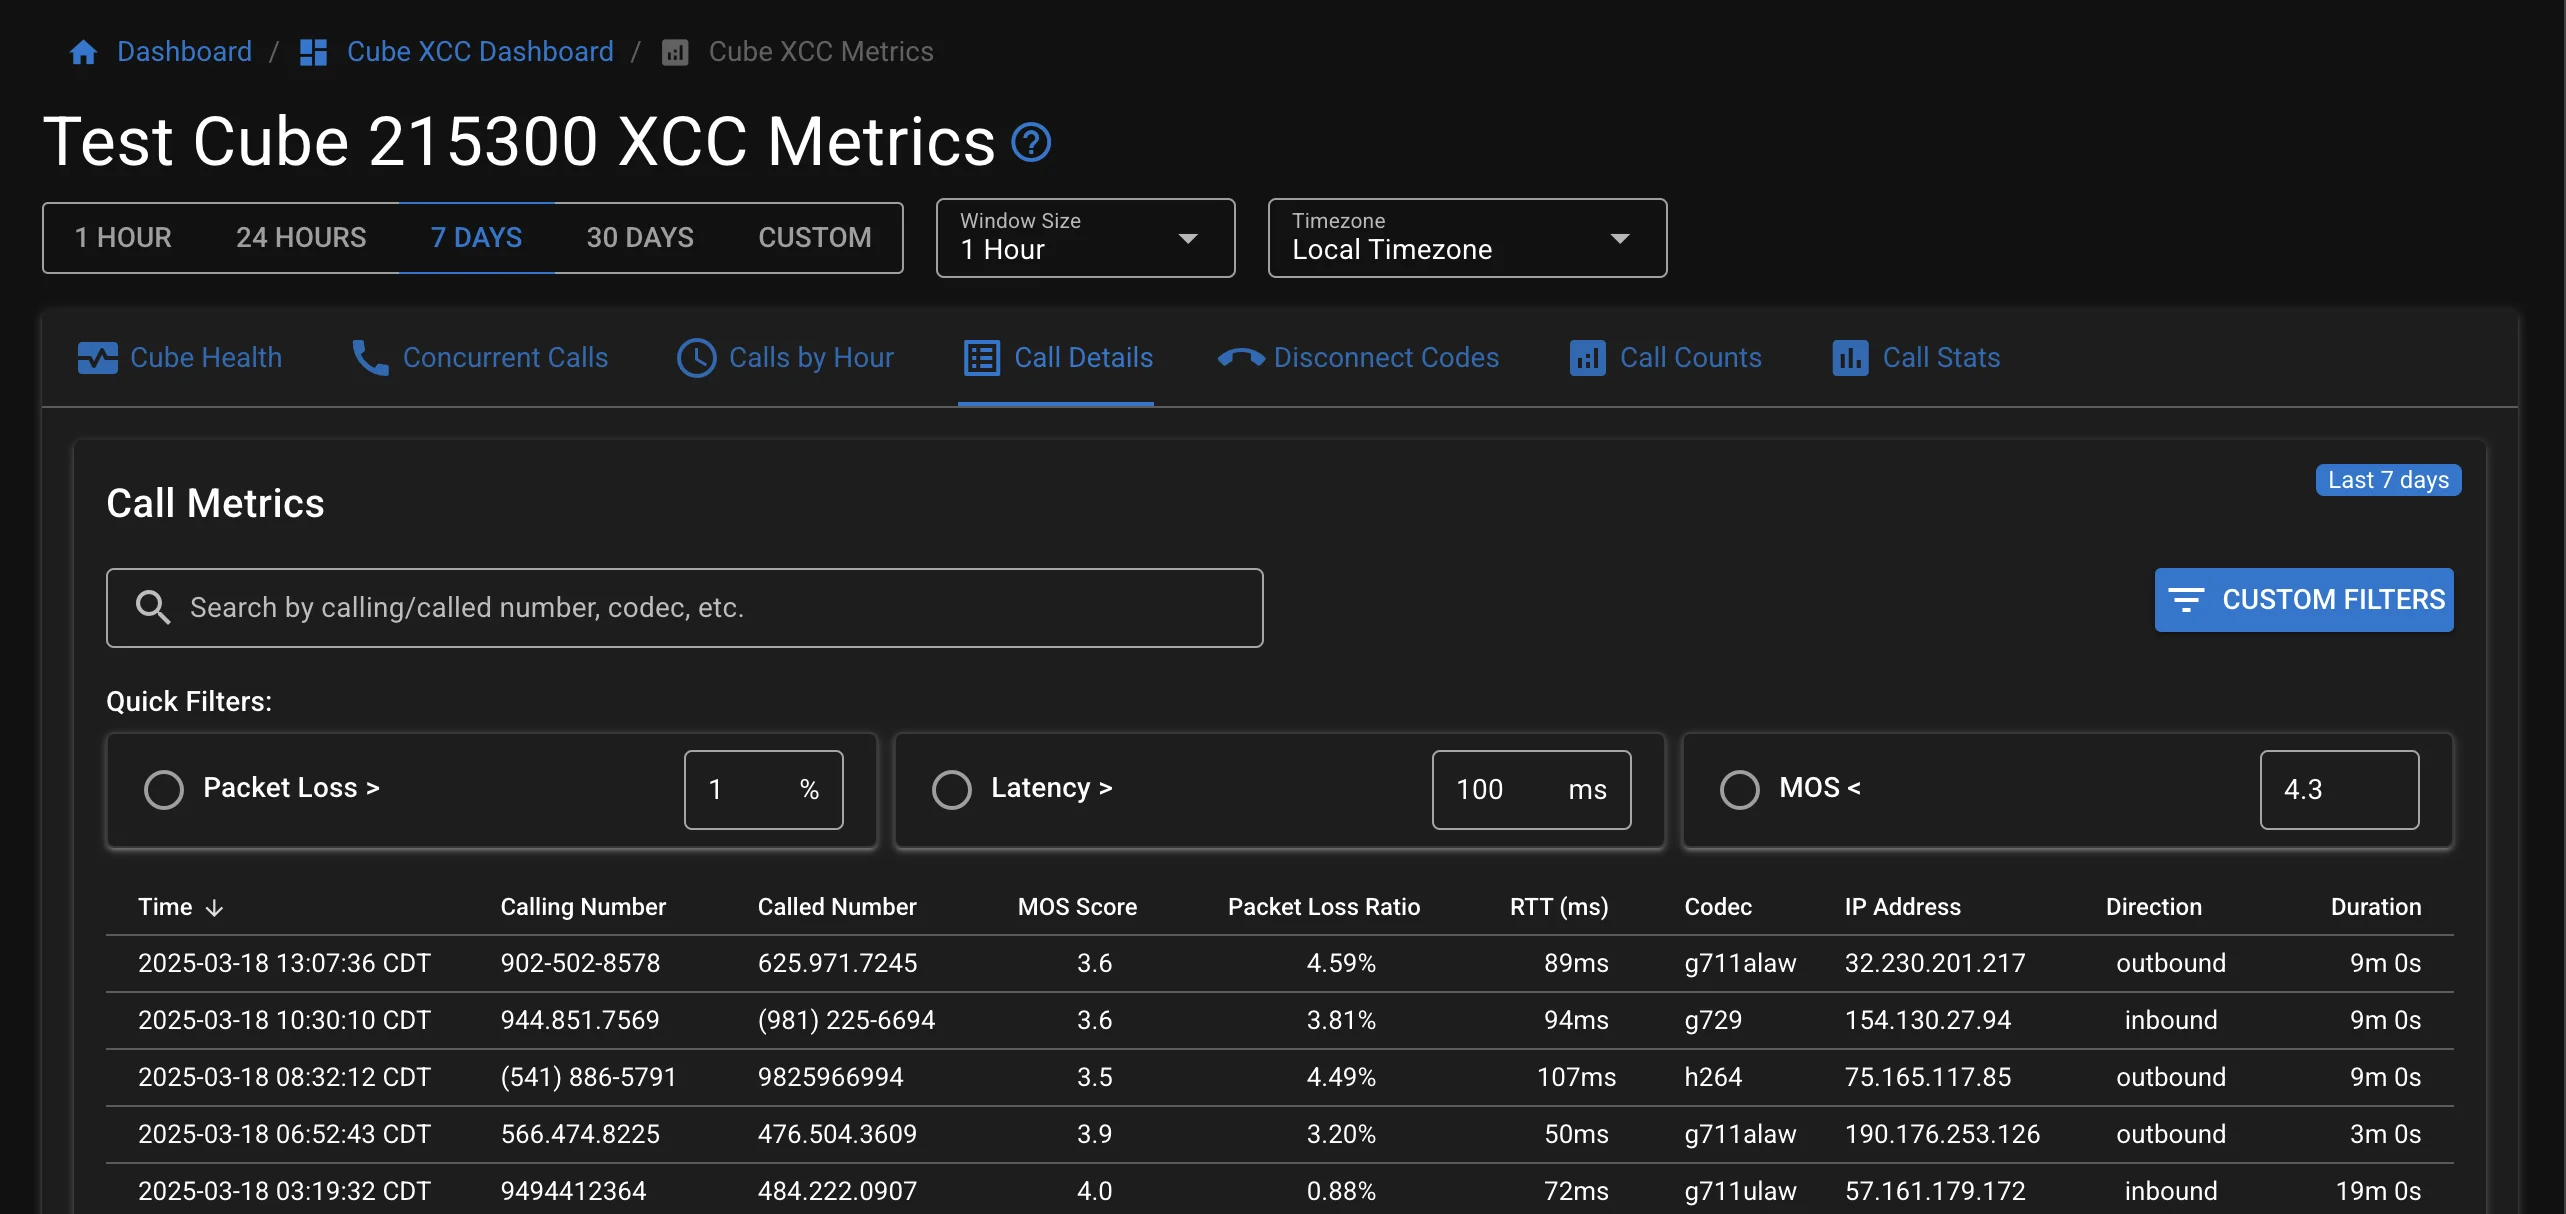
You can filter by time, by peer IP, and several other criteria to narrow down the call records. It's like CDR for calls the CUBE handles, providing a granular view of each call's lifecycle - including internal Call IDs you can use for detailed SIP troubleshooting.
The Call Details tab provides a detailed table of individual calls, including:
- Time: When the call occurred
- Calling Number: The originating phone number
- Called Number: The destination phone number
- MOS Score: Call quality score
- Packet Loss: Percentage of lost packets
- RTT: Round trip time in milliseconds
- Codec: Audio codec used for the call
- Duration: Length of the call
- Disconnect Code: Reason for call termination
The table can be sorted by any column by clicking on the column header.
TIP
Use Call Details tab to find the Call ID for any call you want to investigate further, and collect raw SIP messages from the CUBE.
Advanced Call Investigation with VoIP Trace: When you identify a problematic call in the dashboard, you can use the Call ID for deep CLI investigation on your CUBE. With Cisco IOS XE 17.3.2+, use the built-in VoIP Trace feature to examine complete SIP signaling without performance impact.
VoIP Trace Configuration (enabled by default in IOS XE 17.3.2+):
bash
# Verify VoIP Trace is enabled (default configuration)
router(config)# voice service voip
router(conf-voi-serv)# trace
Investigate calls using dashboard Call IDs:
bash
# Filter traces by internal Call ID from the dashboard
show voip trace call-id <call-id>
This gives you the complete SIP message flow, RTP statistics, and call progression details that correspond directly to the quality metrics shown in your Call Telemetry dashboard.
Disconnect Codes
The Disconnect Codes analysis provides comprehensive insights into call termination patterns with improved call failure categorization and abnormal call filtering through multiple complementary visualizations:
Disconnect Codes Overview
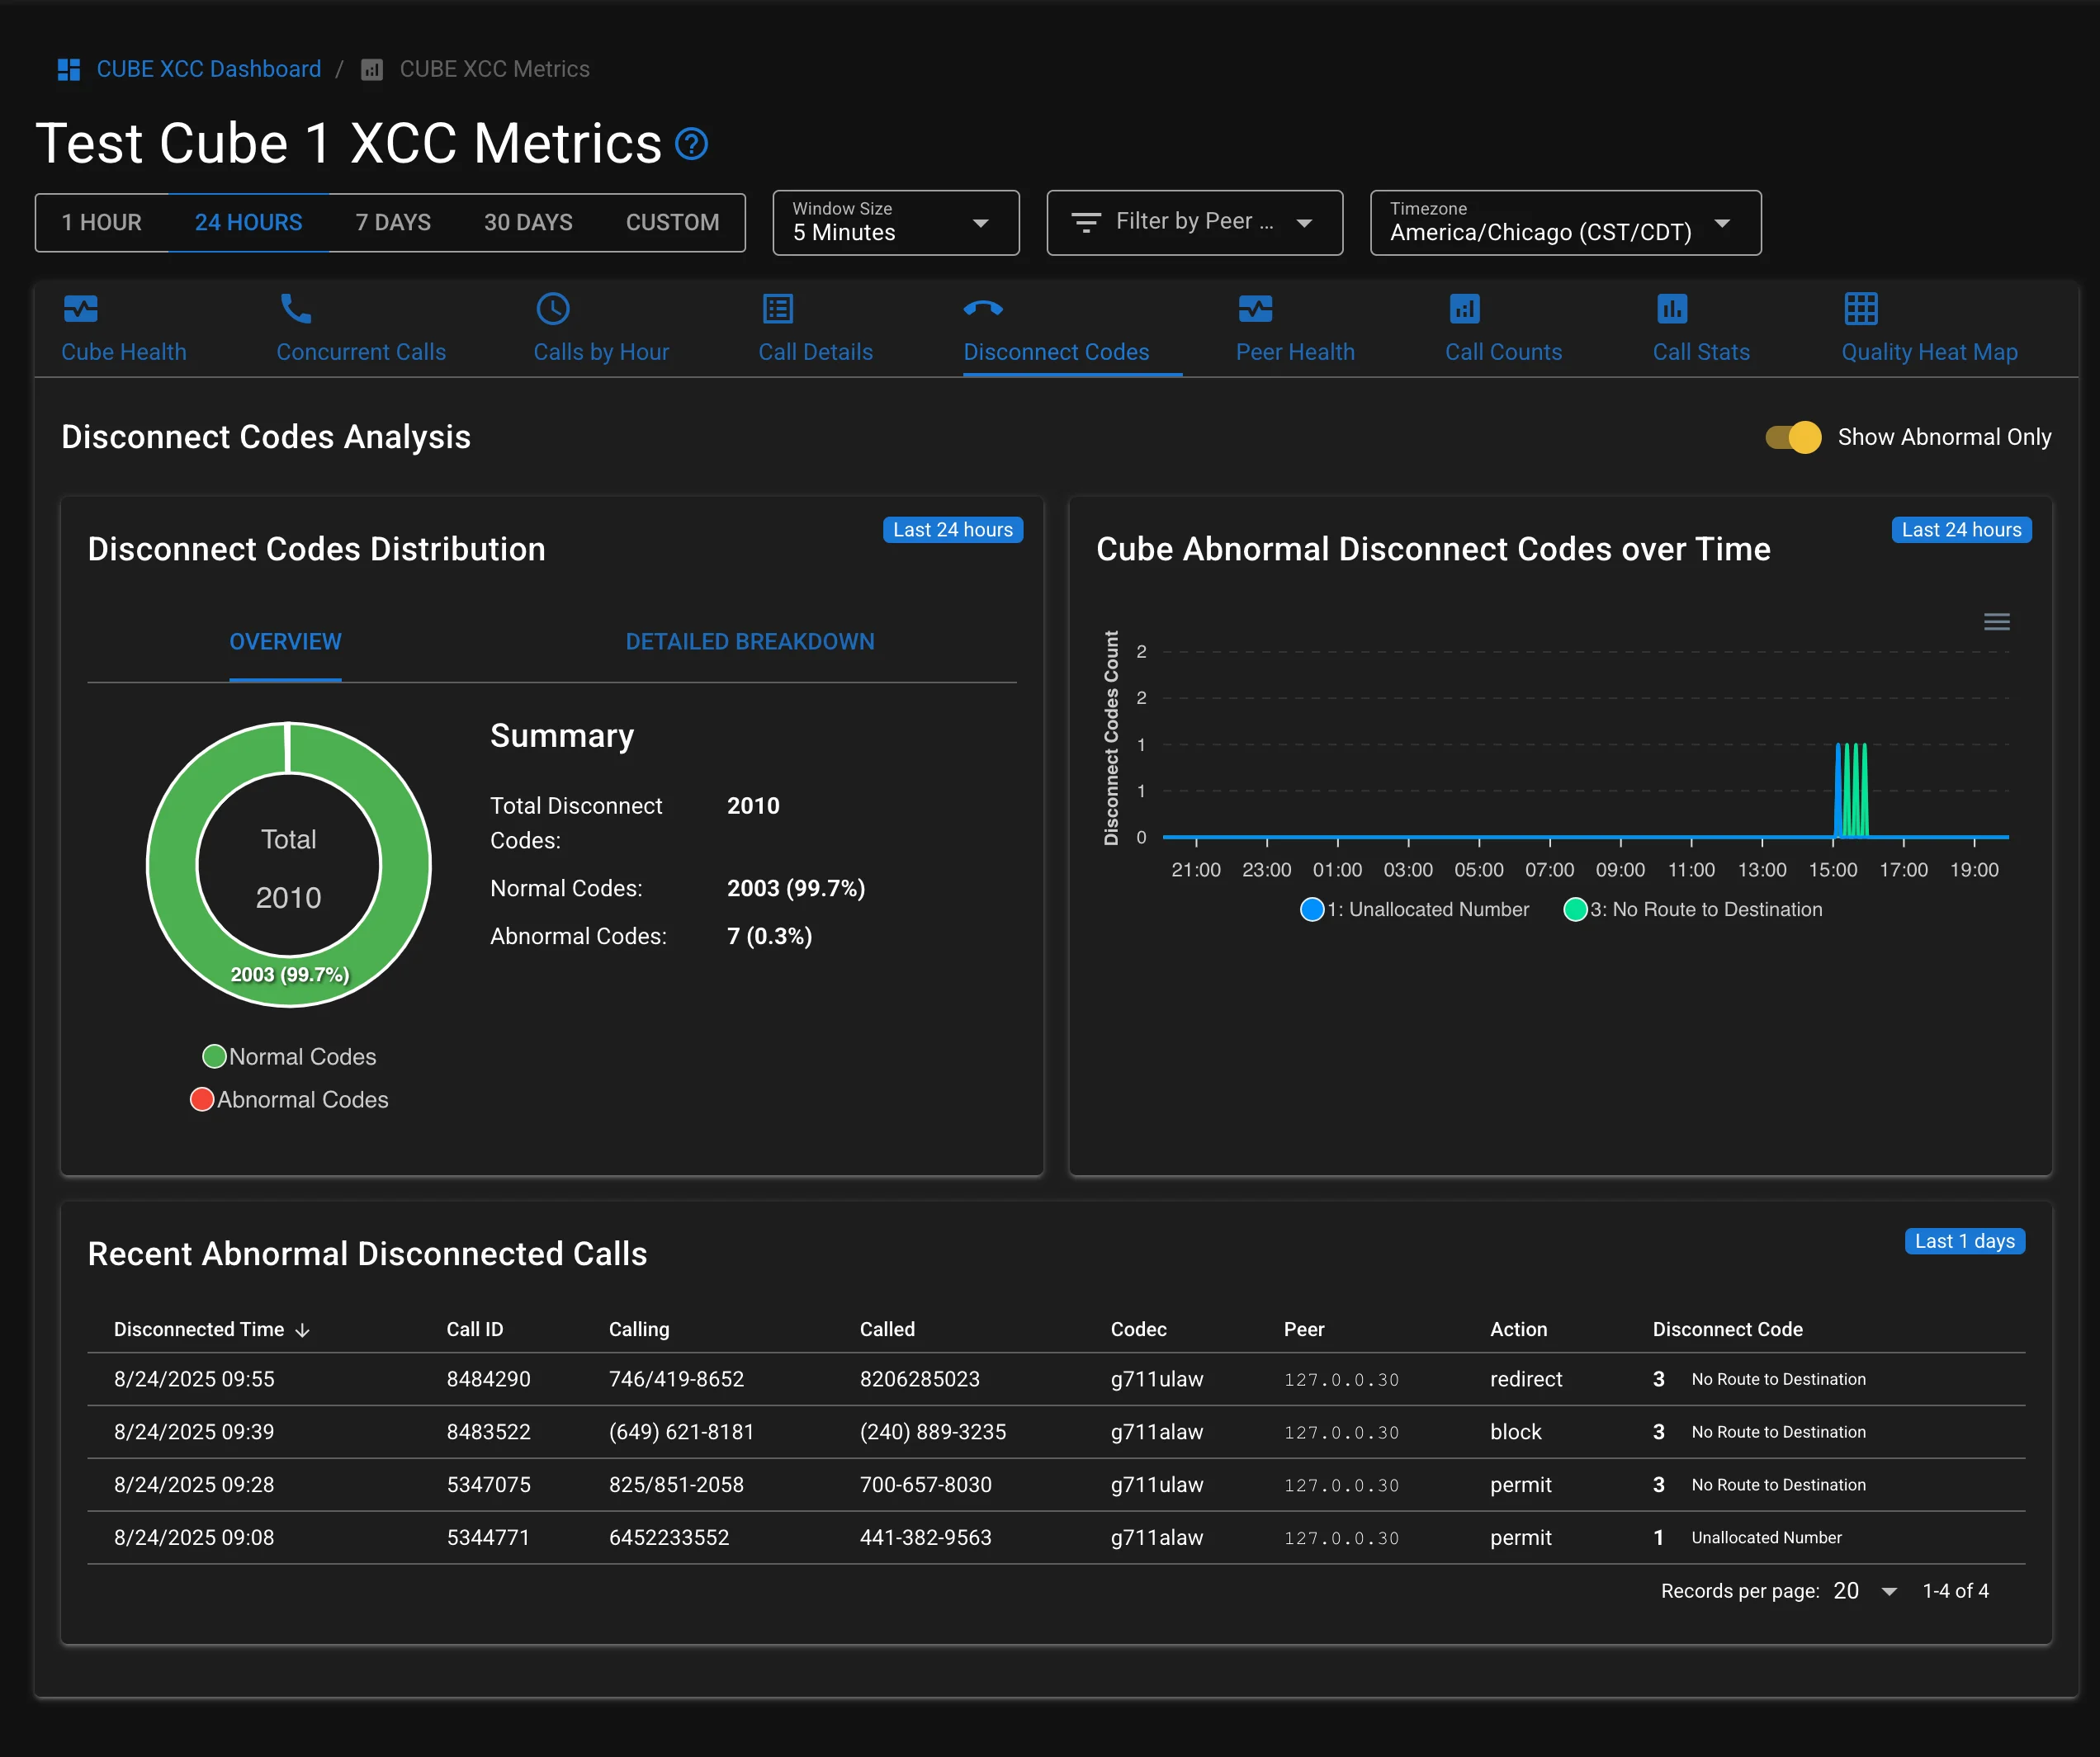
INFO
The Abnormal Disconnect Code chart above shows you failed calls, include the exact calls impacted during the outage, and their Cube Call IDs.
The stacked area chart shows the frequency of different call termination reasons over time. This helps identify patterns in call disconnections and potential issues.
Common ITU Q.850 disconnect codes include:
- 16: Normal call clearing
- 17: User busy
- 18: No user responding
- 19: No answer from user (user alerted)
- 21: Call rejected
- 42: Network/switching congestion
- 63: Service or option unavailable
For the complete list of ITU Q.850 cause codes used by Cisco CUBE XCC, see Cisco's Voice Router Internal Call Disconnect Cause Code Table.
Disconnect Codes Distribution
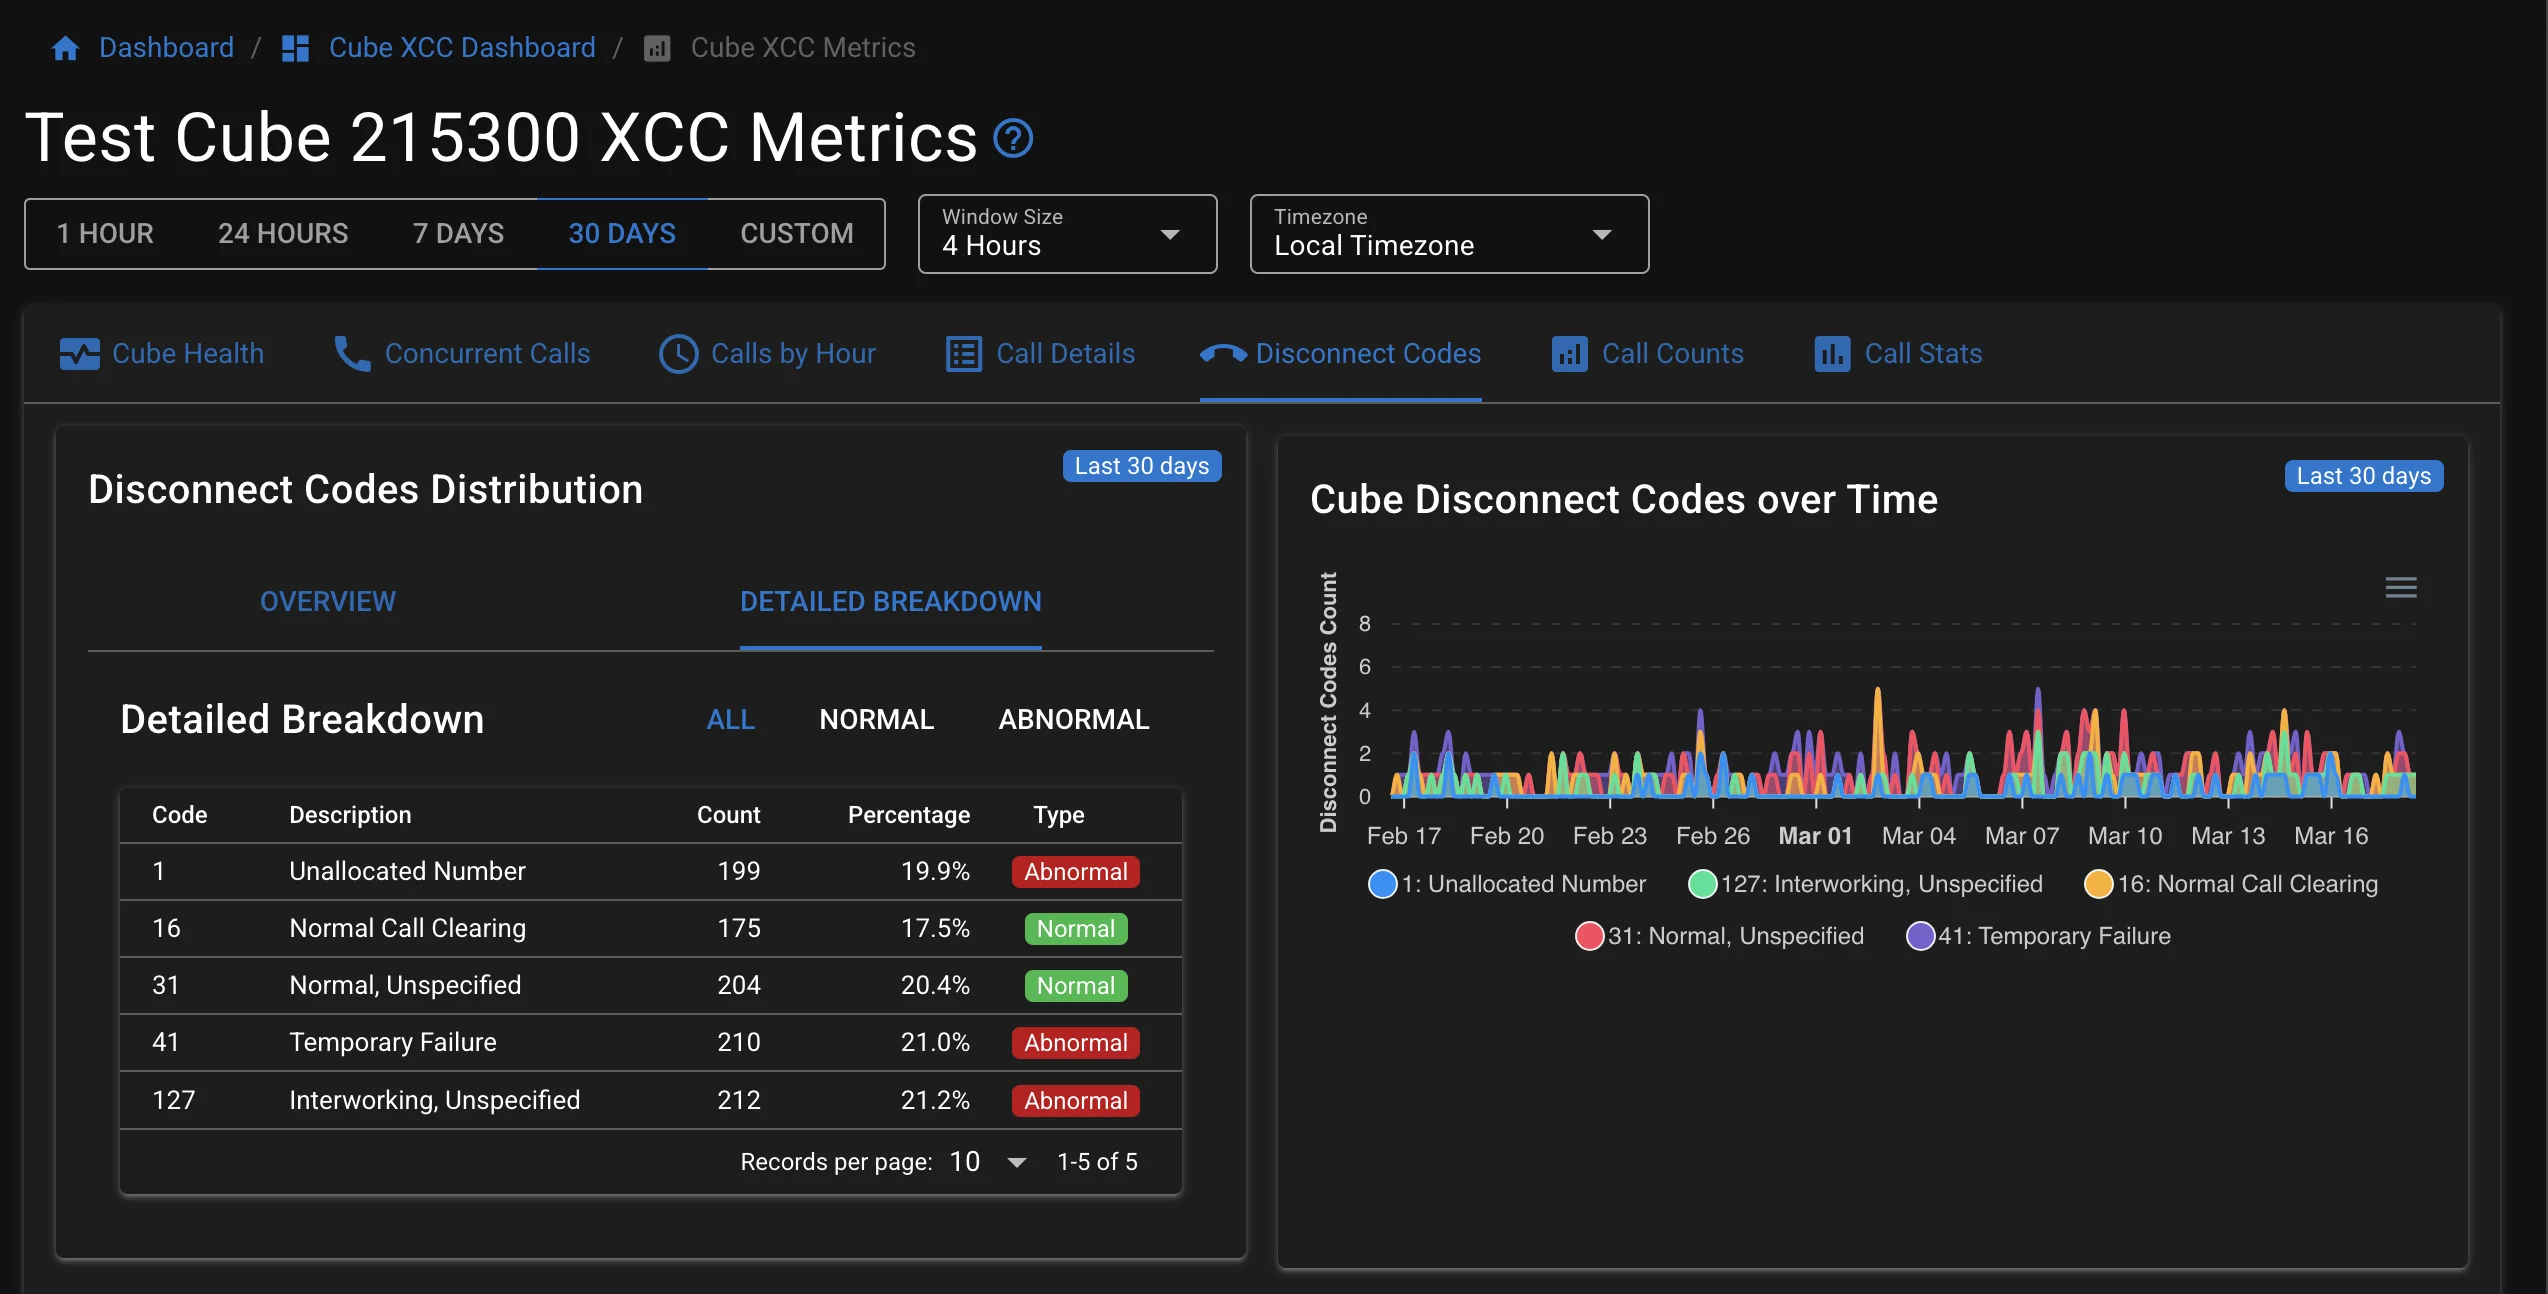
The Disconnect Codes Distribution chart provides a high-level view of normal versus abnormal disconnect codes, helping you quickly assess the health of your call termination patterns.
Normal Codes: Disconnect codes that represent normal call clearing events
- Code 16: "Normal Call Clearing"
- Code 31: "Normal, Unspecified"
Abnormal Codes: All other disconnect codes, which may indicate issues with the call
The chart displays:
- Total count of all disconnect codes in the selected period
- Count and percentage of normal disconnect codes
- Count and percentage of abnormal disconnect codes
- Visual representation of the distribution as a pie or donut chart
This visualization helps you quickly identify if your system is experiencing an unusual number of abnormal call terminations, which may warrant further investigation.
Total Calls by Hour
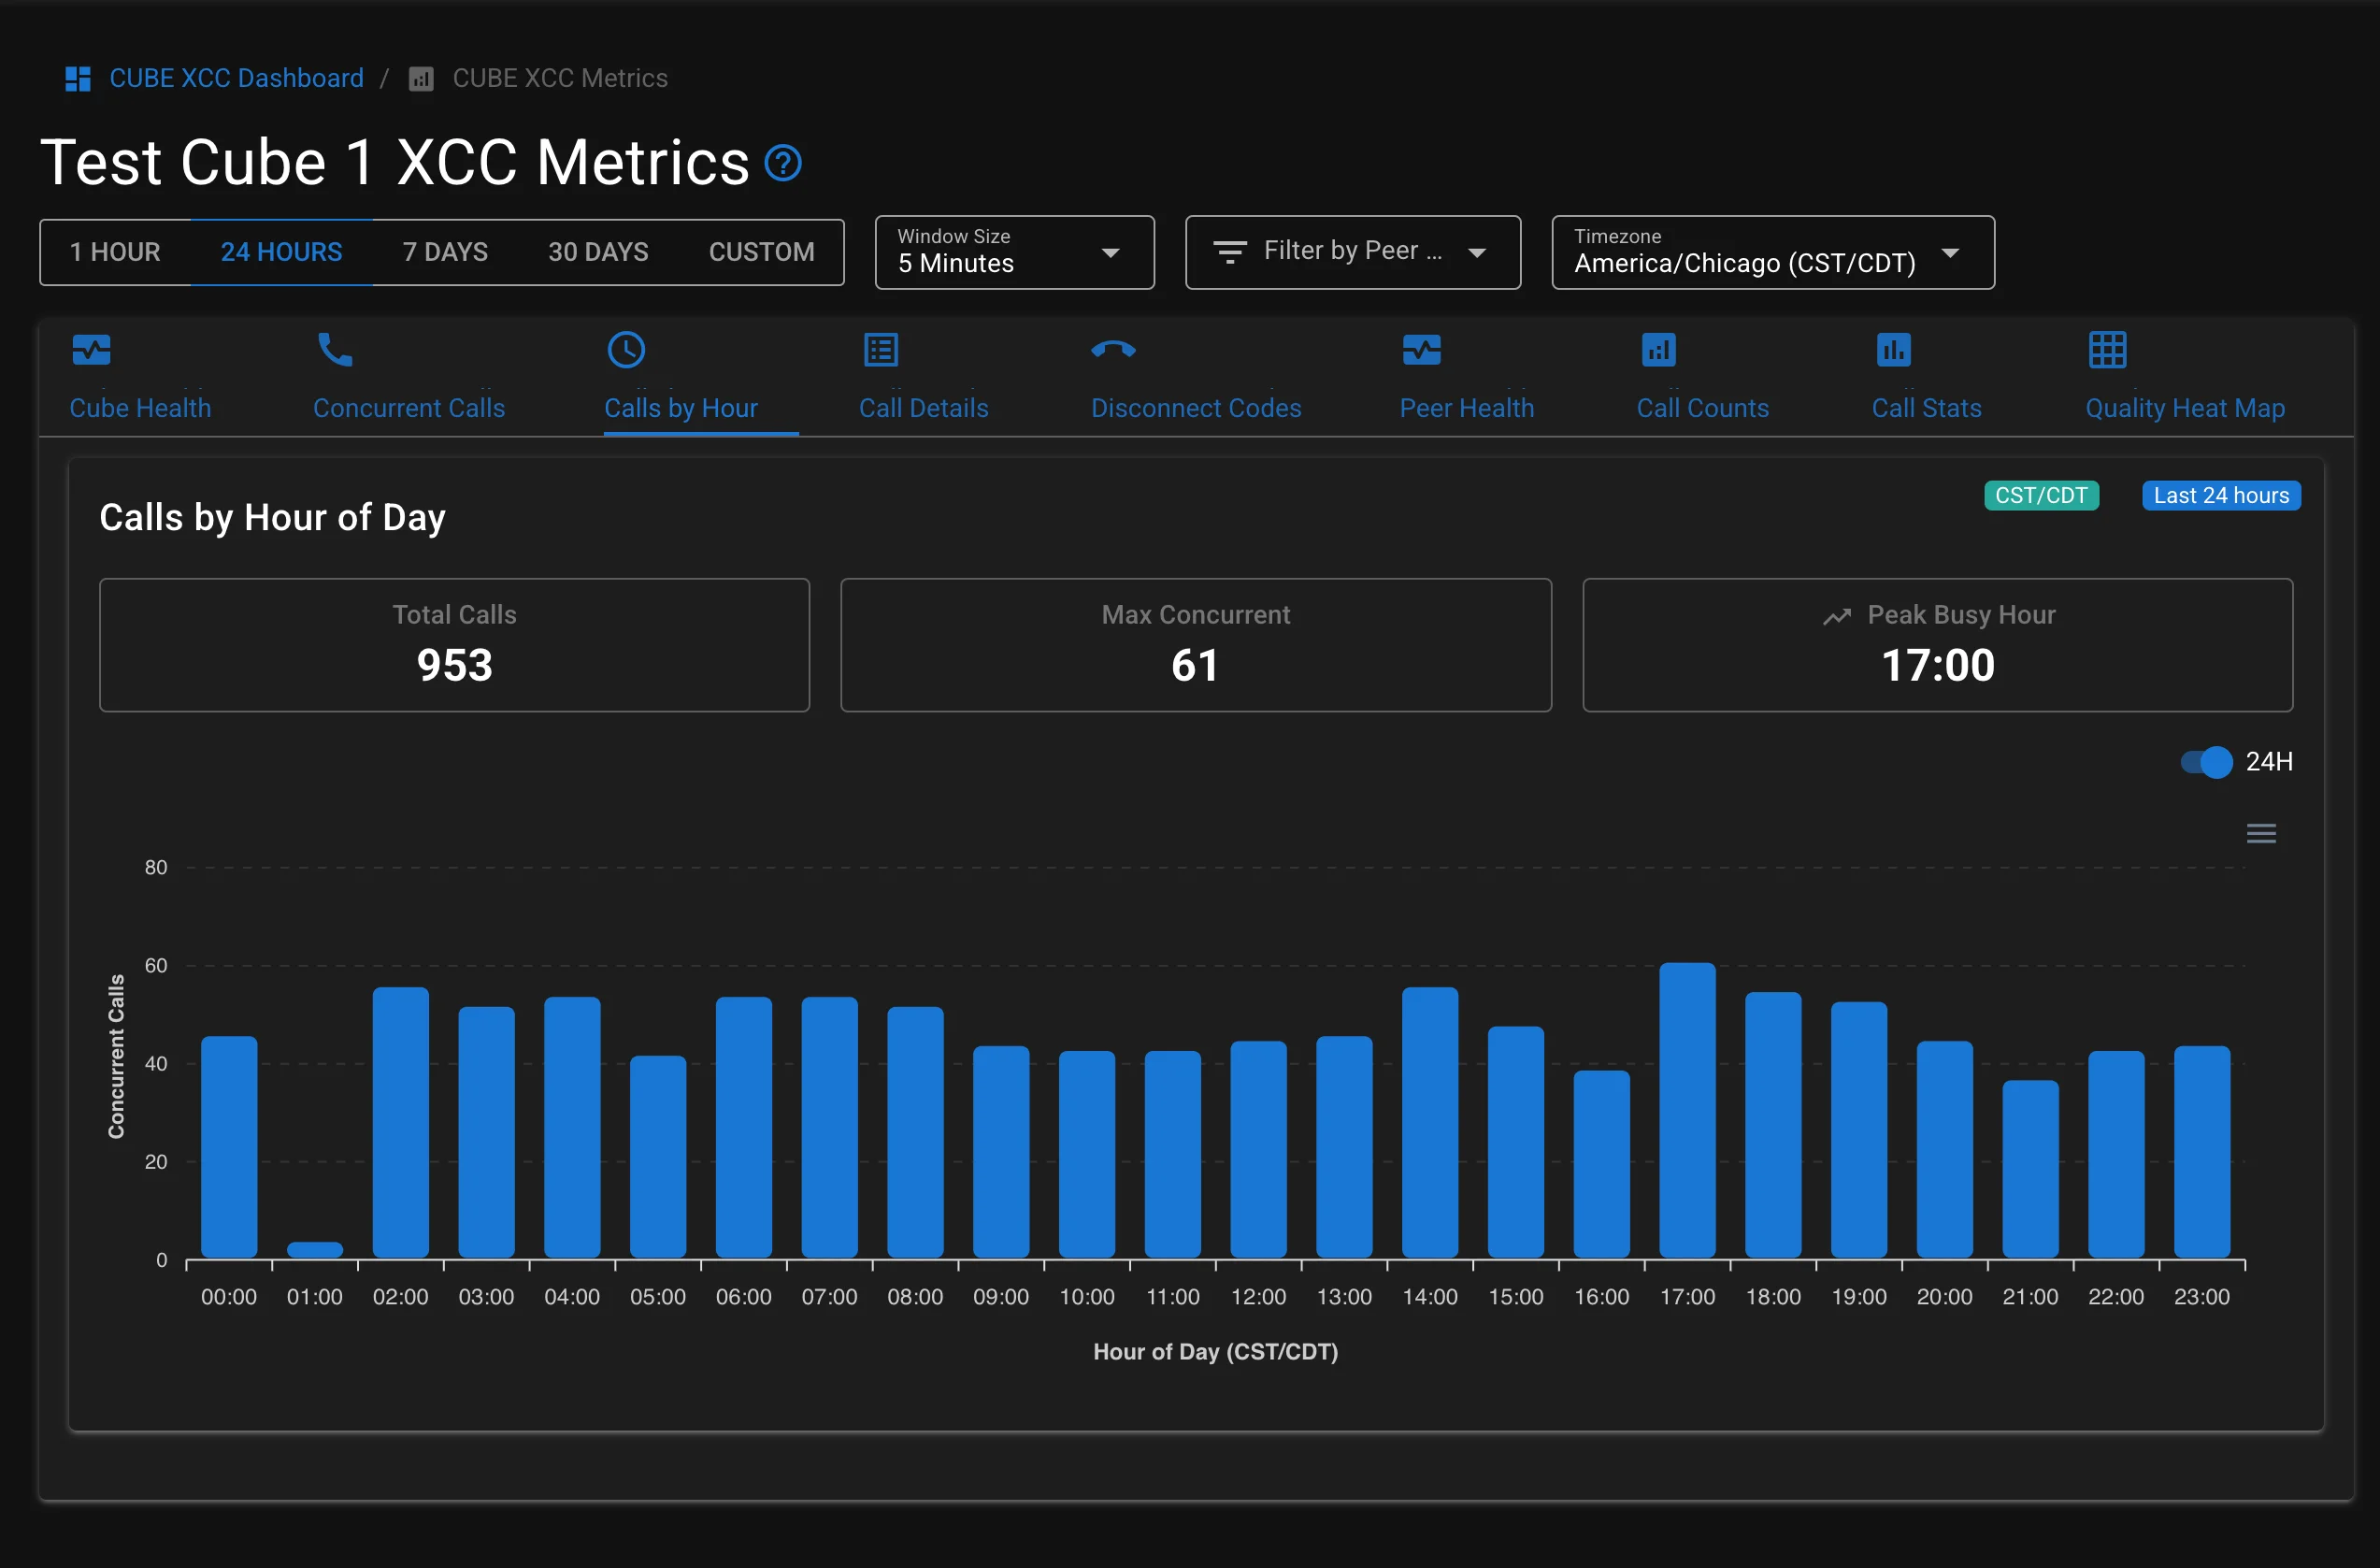
The Calls by Hour chart provides a visualization of call volume distribution across different hours of the day. This helps you identify:
- Peak calling hours
- Business hour patterns
- After-hours call volume
- Capacity planning opportunities
This view is particularly useful for identifying when your system experiences the highest load, allowing you to plan resources accordingly and ensure adequate capacity during peak hours.
Inbound/Outbound Calls
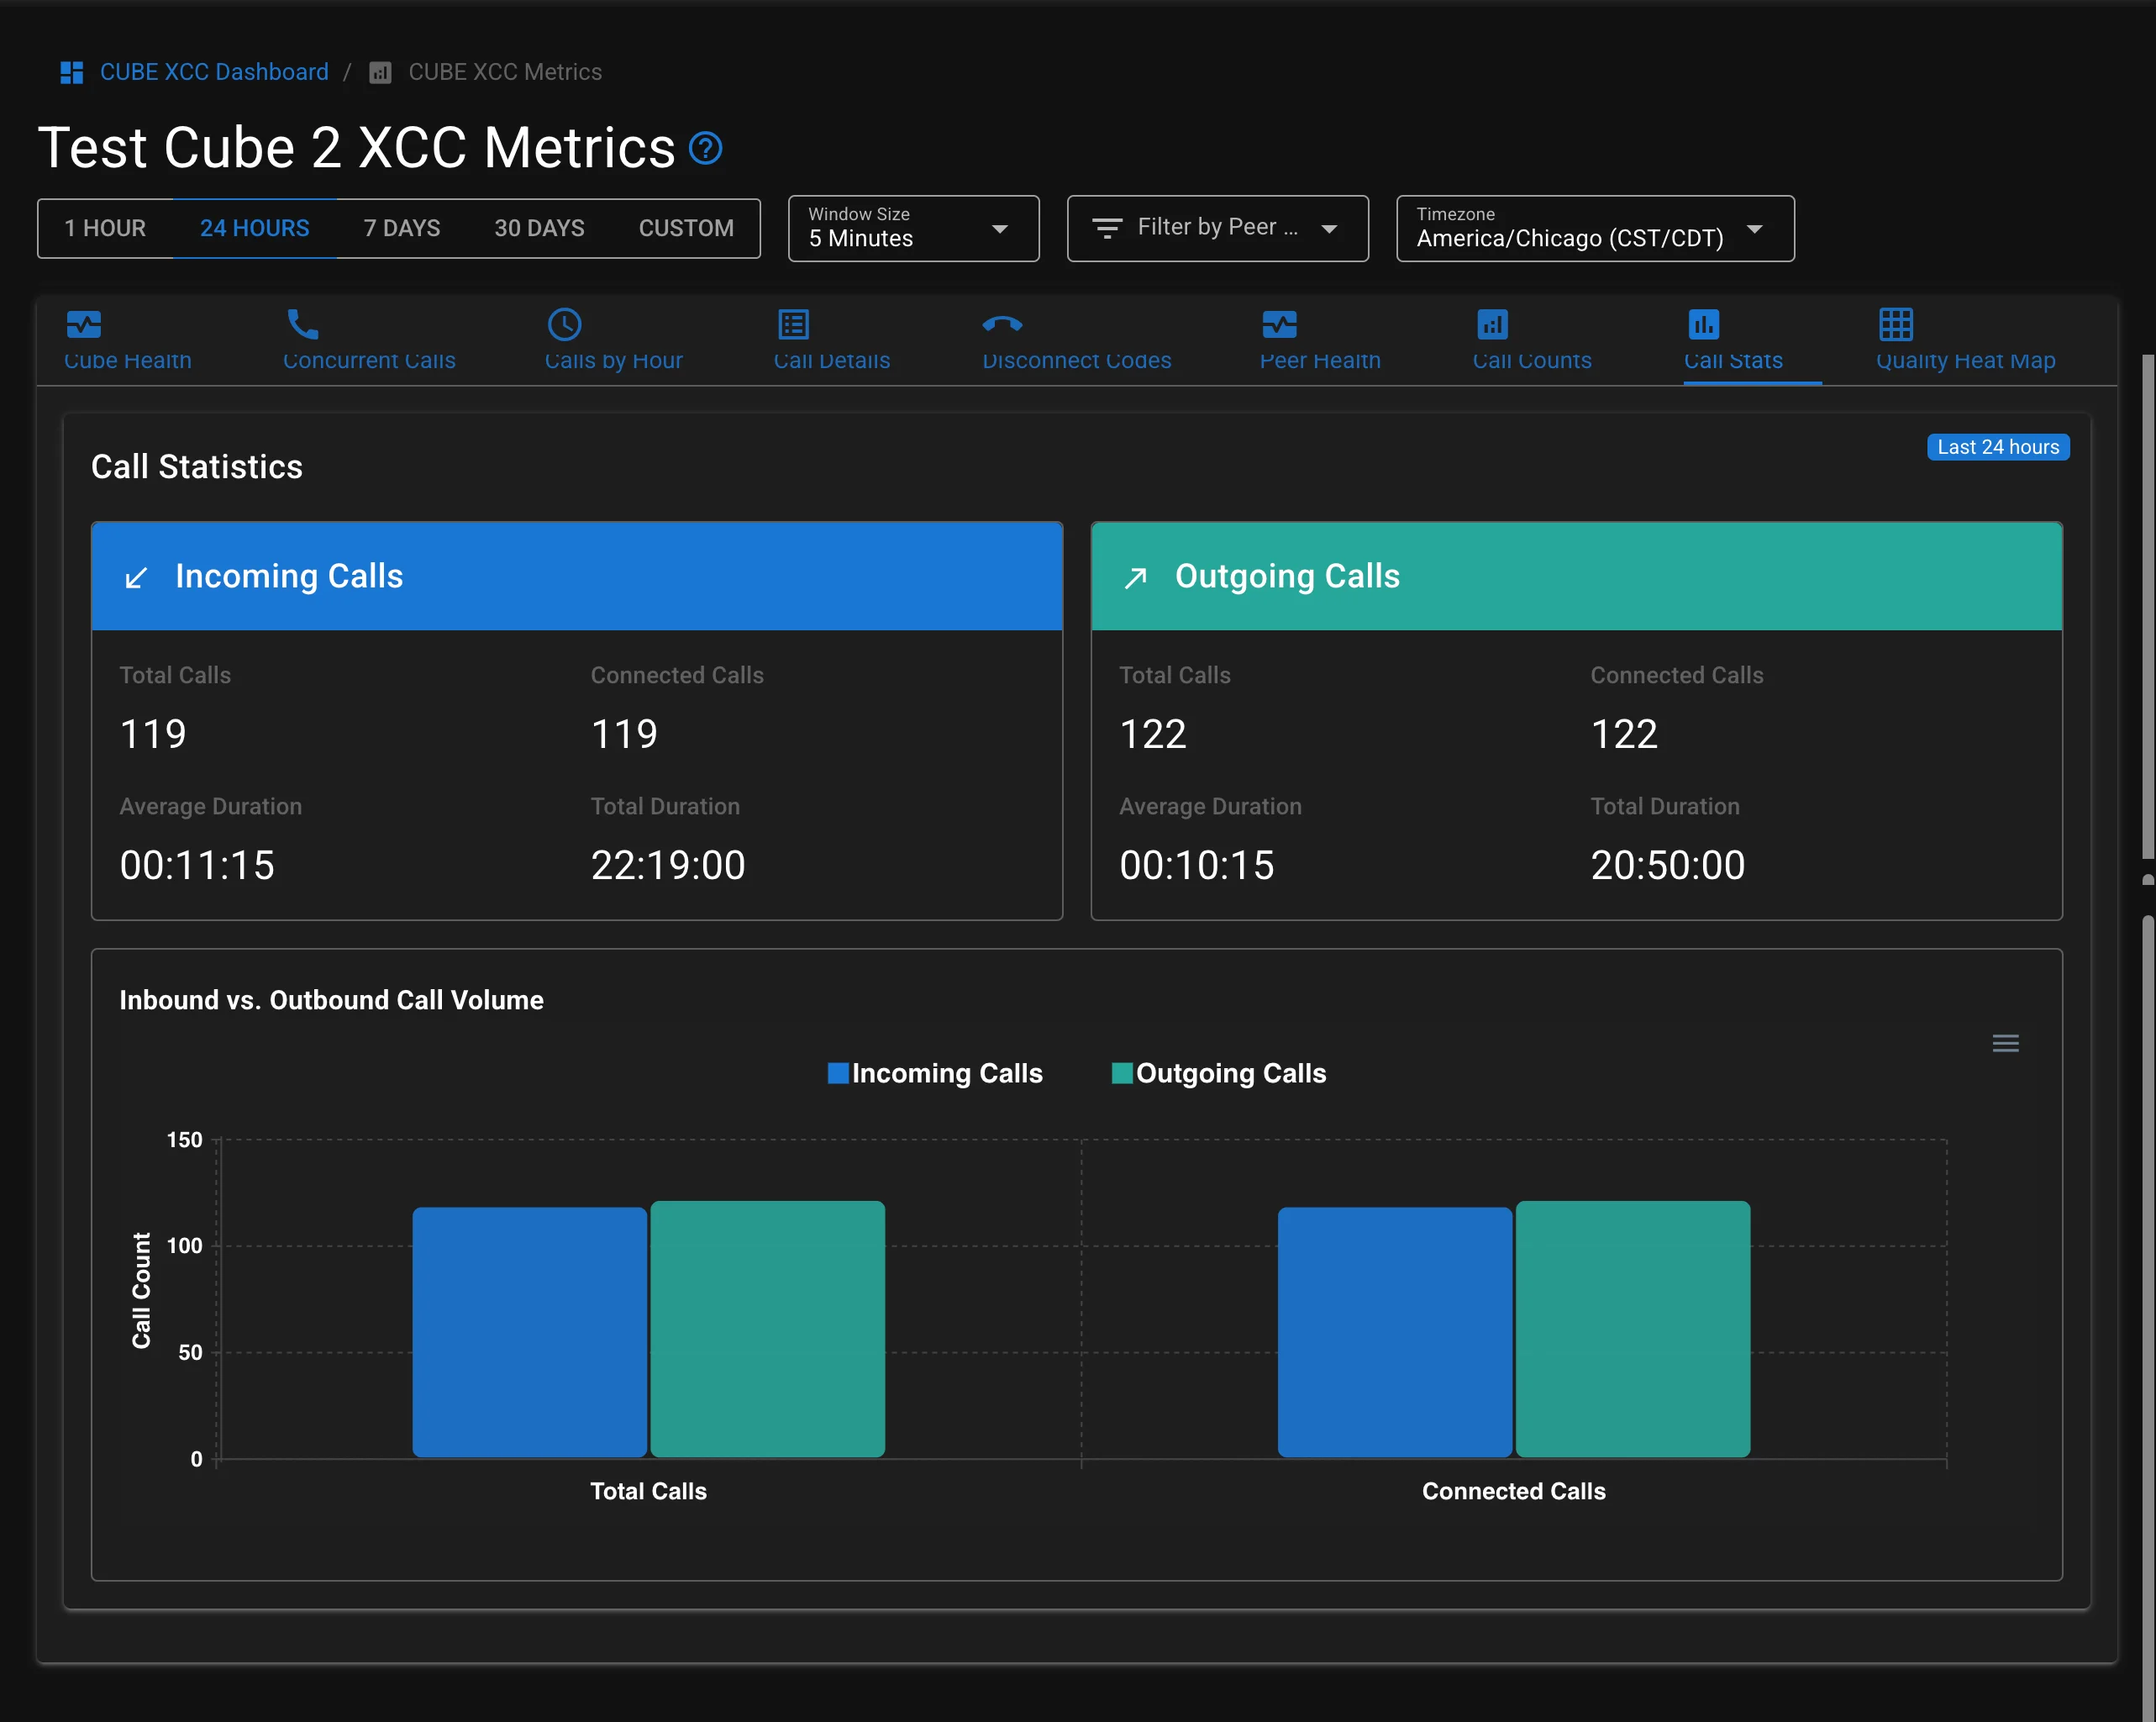
The Inbound/Outbound Calls tab provides a comparative analysis of incoming and outgoing call traffic over time. This visualization helps you:
- Monitor the balance between inbound and outbound calls
- Identify trends in call direction patterns
- Analyze customer service vs. outreach activities
- Optimize staffing for inbound call handling
The chart displays inbound calls (calls received by your system) and outbound calls (calls initiated from your system) as separate lines, allowing you to easily compare volumes and identify patterns or anomalies in either direction.
Data Export
All reports can be exported to your preferred format for further analysis or reporting:
- Navigate to the desired tab (Cube Health, Concurrent Calls, etc.)
- Click the Export button in the top-right corner
- Choose your preferred format (CSV, Excel, PDF)
- Select the time range for the export
- Click Download as [chosen format]
Cube XCC API - Metrics without CUBE CDR
Metrics from P-RTP-Stat
When a SIP call ends, CUBE automatically adds a P-RTP-Stat header in BYE/200 OK messages with comprehensive call statistics. This Cisco-native SIP feature is enabled by default and provides detailed end-of-call quality metrics (packet loss, jitter, RTT) specifically for SIP call legs.
http
P-RTP-Stat: PS=1420,OS=227200,PR=1418,OR=226880,PL=2,JI=12,LA=45,DU=32Complete P-RTP-Stat Field Mapping:
- PS (Packets Sent) / PR (Packets Received) → Packet loss calculations
- PL (Packets Lost) → Direct packet loss percentage for quality assessment
- JI (Jitter) → Feeds MOS score calculations and quality trending
- LA (Round Trip Delay) → RTT measurements for network latency analysis
- DU (Call Duration) → Duration metrics for capacity and usage analytics
- OS (Octets Sent) / OR (Octets Received) → Bandwidth utilization tracking
Real-Time Advantage: Unlike CDR-based systems that process call records minutes later, P-RTP-Stat headers provide immediate end-of-call statistics that appear in dashboards within seconds. This enables real-time troubleshooting and immediate quality alerts.
Configuration Note: If P-RTP-Stat headers aren't present or are empty, verify
media statistics,media bulk-stats, andcall-qualityare enabled on CUBE. The round-trip delay (LA) value requires RTCP support from the remote endpoint.